Robustness Testing
This document outlines the workflow and mechanics of the Robustness Testing feature. Robustness testing helps you evaluate whether a quantitative trading strategy possesses a genuine, repeatable edge or if its historical performance is the result of favorable anomalies and luck.
What is Robustness Testing?
Robustness Testing applies systemic stress to your historical Trade data without requiring you to change your strategy's underlying logic. By randomizing Trade execution order or artificially skipping Trades, you can visualize how fragile or resilient your strategy's profit expectancy is under sub-optimal conditions.
The Tick2Tick Dashboard provides two primary testing methodologies: Trade Skipping and Monte Carlo Simulation.
Open a Robustness Testing Page
To navigate to the Robustness Testing page of a specific Statistics Request, visit the My Statistics Requests page within the Tick2Tick Dashboard.
Locate the Request you wish to analyze from your list and click the Robustness button on the left side of the data grid.
Trade Skipping
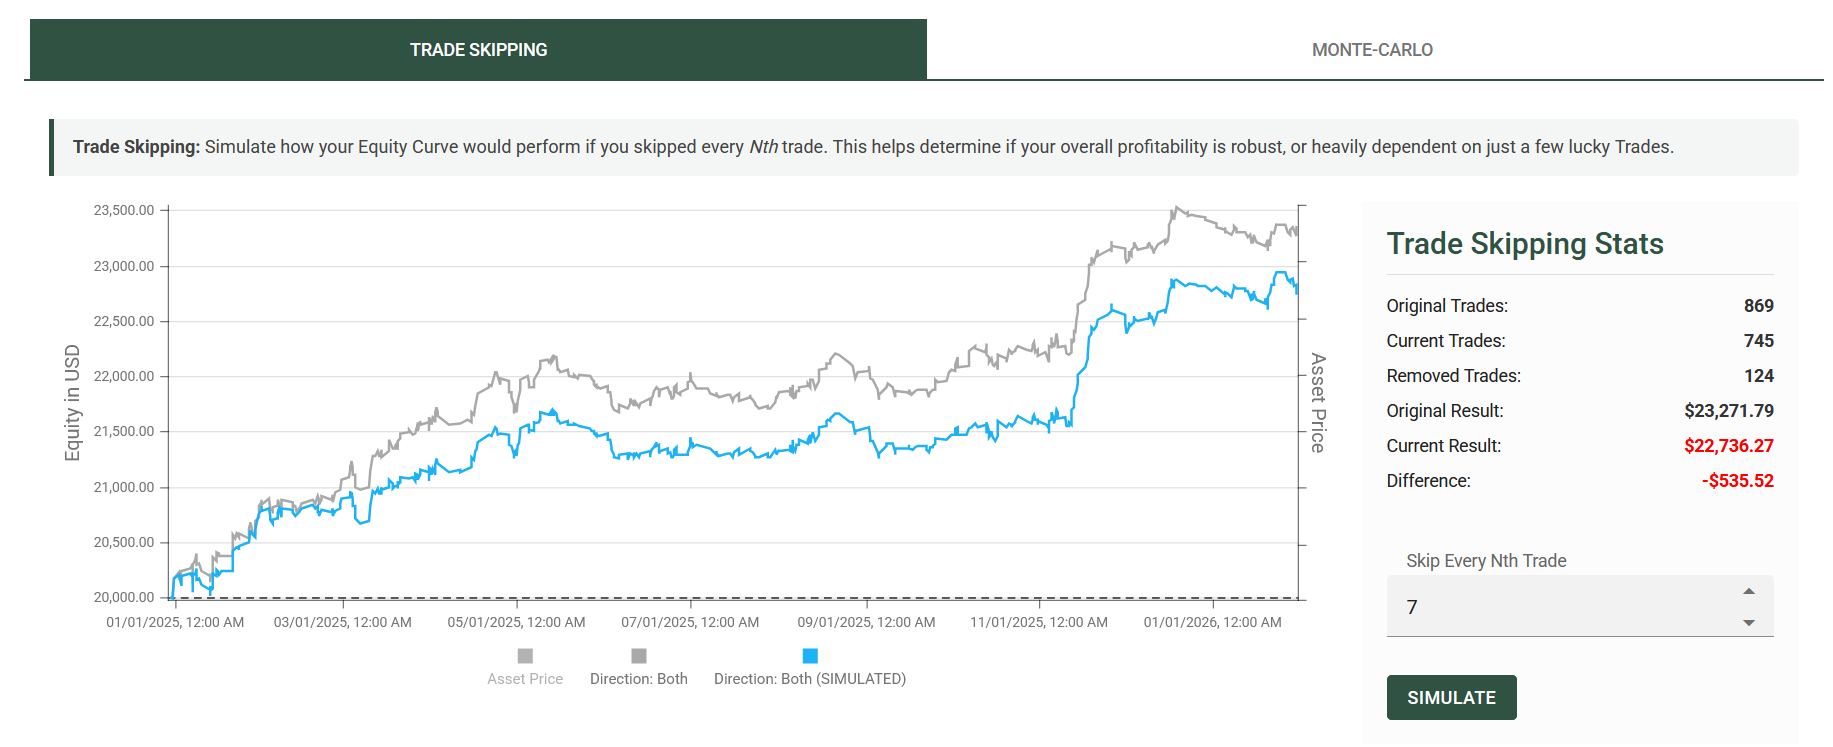
The Trade Skipping module simulates how your Equity Curve would perform if you missed every Nth Trade.
In live trading, missing Trades is inevitable due to platform disconnects, slippage, human error, or time constraints. If a strategy's profitability relies entirely on catching a small handful of massive outlier Trades, skipping just one of those Trades can turn a winning system into a losing one.
How it works:
- Navigate to the Trade Skipping tab.
- In the right pane, locate the Skip Every Nth Trade input box.
- Enter an integer between 2 and 10 (e.g., entering
10means the system will remove every 10th chronological Trade from the dataset). - Click Simulate.
The chart on the left will immediately update to draw a new Equity Curve (overlaid against your original, grayed-out curve) showing the adjusted trajectory.
Analyzing the Stats: The right pane provides a statistical breakdown comparing your original performance against the simulated performance.
- Original vs. Current Trades: Shows how many executions were parsed out of the dataset.
- Current Result: The new theoretical profit or loss.
- Difference: A direct monetary comparison. A highly negative difference indicates a fragile system heavily reliant on specific, sequenced Trades.
Monte Carlo Simulation
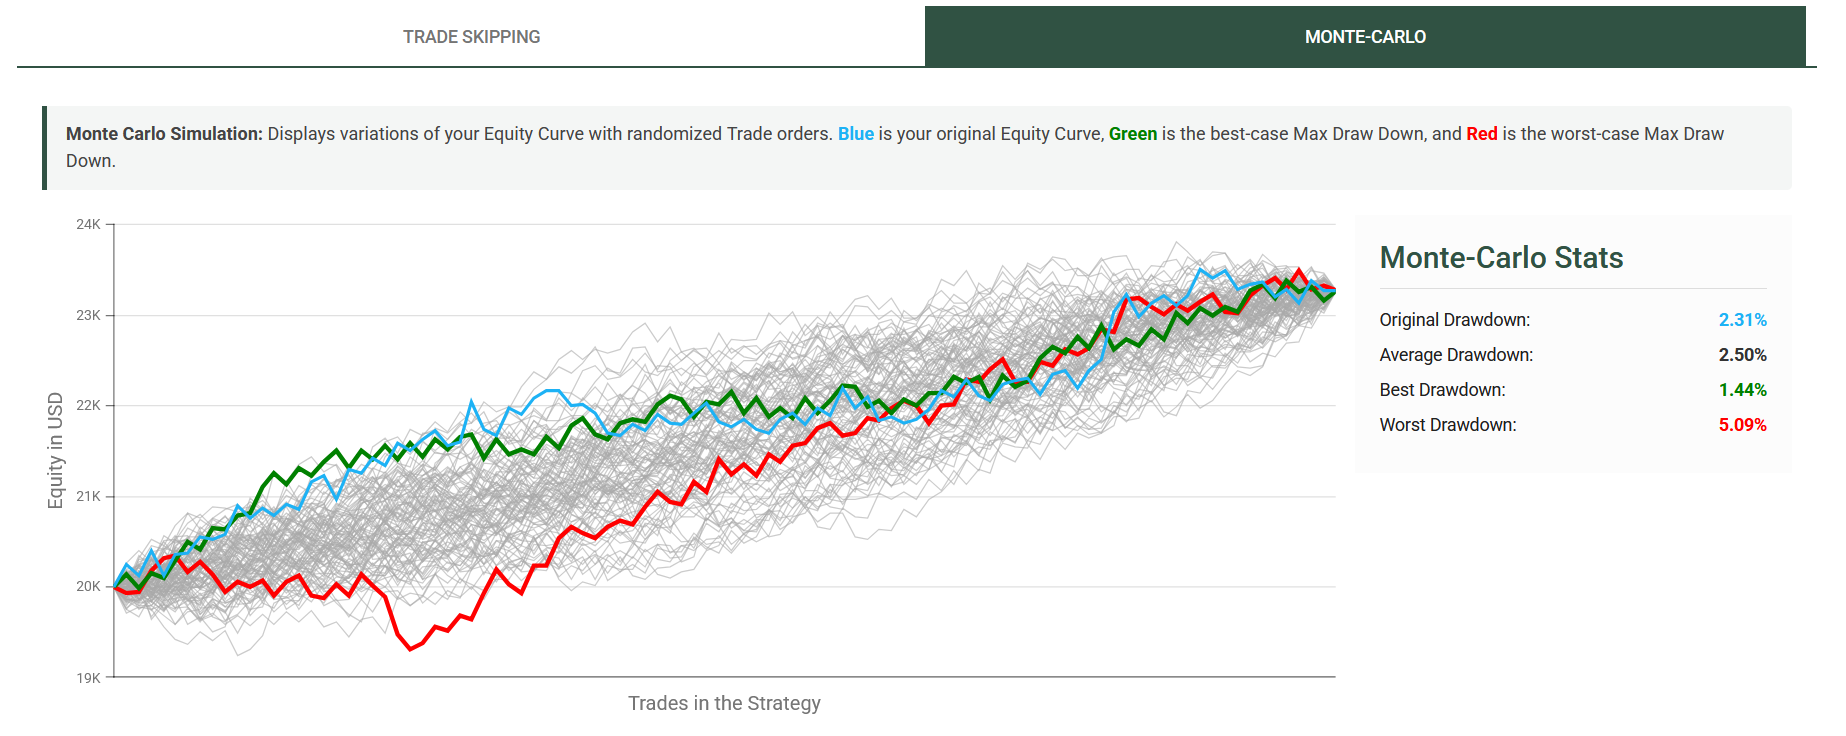
The Monte Carlo module runs distinct simulations, randomizing the chronological order of your historical Trades in each run.
Because market sequencing is entirely random (you cannot predict if your next 10 Trades will be winners or losers), a strategy must be able to survive severe drawdown sequences regardless of when they occur.
How it works: The simulation runs automatically upon opening the Monte-Carlo tab. The server takes your original Trade pool, shuffles the execution order, and plots all resulting Equity Curves on a single chart to visualize the variance in potential outcomes.
Analyzing the Chart:
- Blue Line: Your original, chronological Equity Curve.
- Green Line: The simulation run that resulted in the best (shallowest) Maximum Drawdown.
- Red Line: The simulation run that resulted in the worst (deepest) Maximum Drawdown.
- Gray Lines: The remaining randomized simulation runs.
Analyzing the Stats: The right pane isolates the Maximum Drawdown metric across the simulations:
- Original Drawdown: The maximum peak-to-trough drop experienced in your actual backtest.
- Average Drawdown: The mean drawdown across all iterations (simulations + Original).
- Worst Drawdown: The absolute worst-case scenario. If this number exceeds your risk tolerance or account margin limits, the strategy is mathematically unsafe to Trade, even if the final result is profitable.
Always ensure your strategy is capitalized well beyond the Worst Drawdown metric generated by the Monte Carlo simulation to protect against the risk of ruin.