Understand the Workflow
This document provides an overview of how Tick2Tick Statistics operates - from submitting a Statistics Request to receiving the final Results.
System Overview
The diagram below illustrates the structure of the Tick2Tick Statistics Ecosystem:
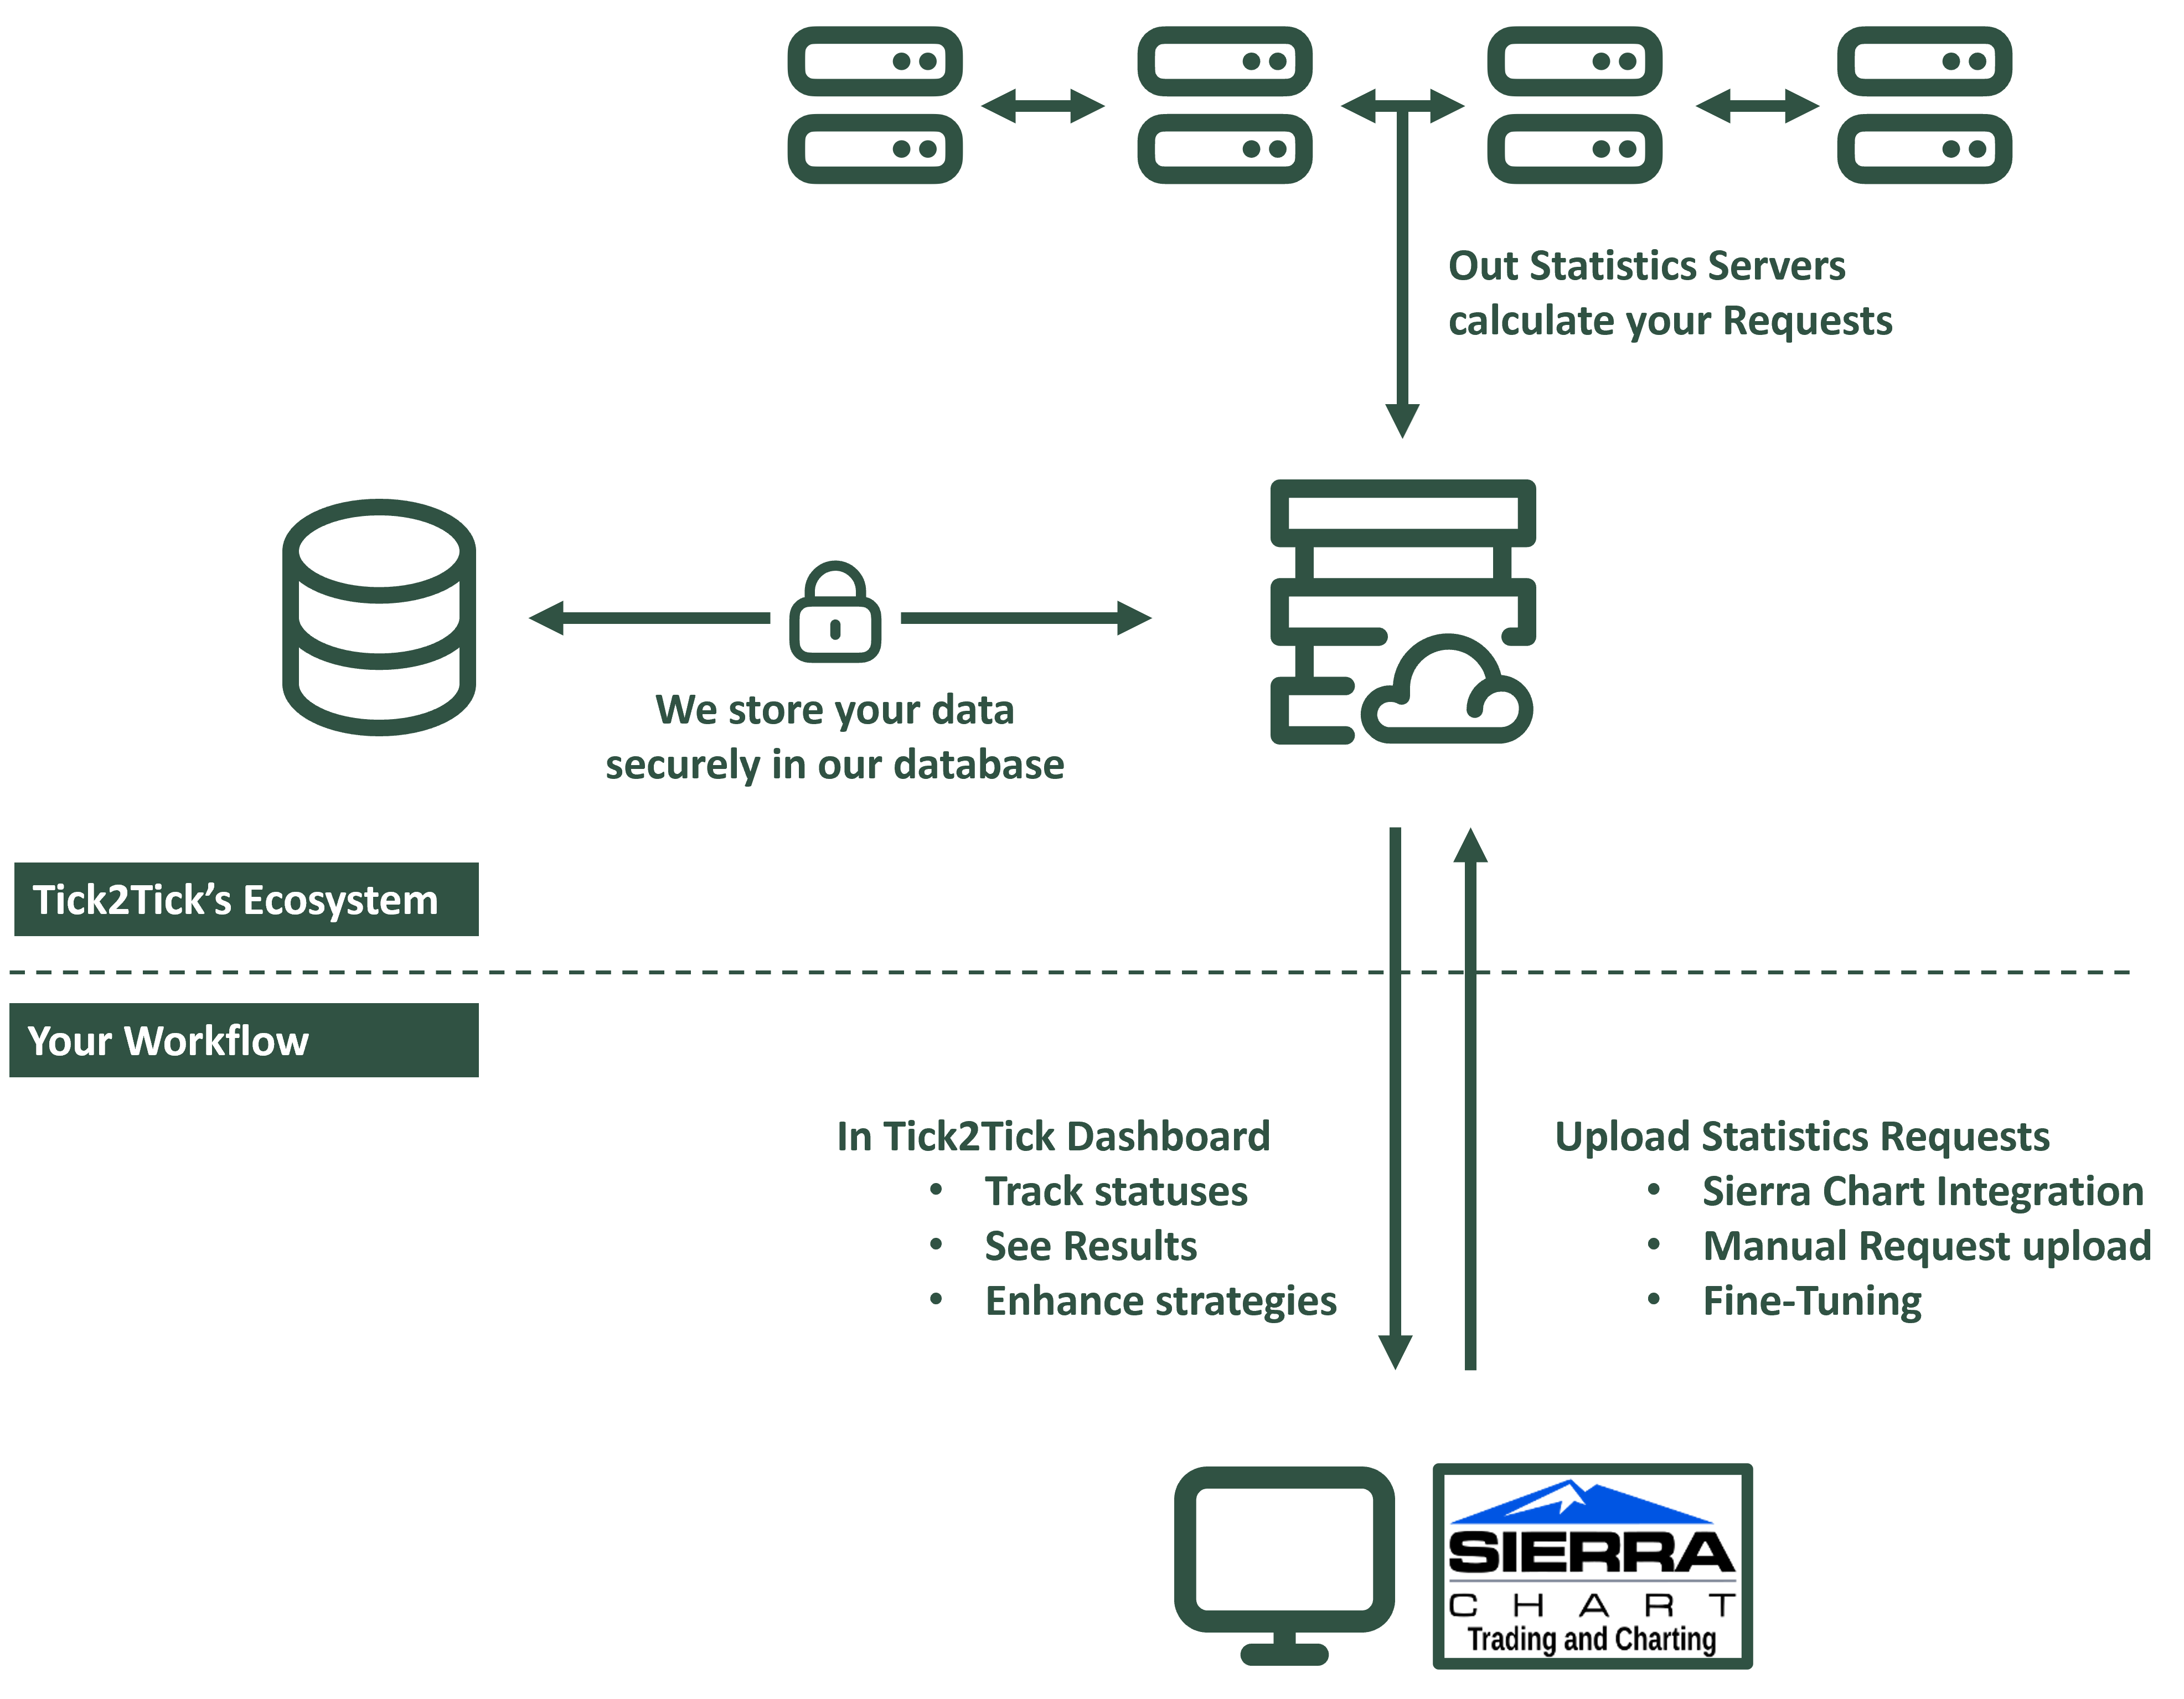
Tick2Tick Statistics – System Overview
Your Workflow
You can submit Statistics Requests through several methods:
- Sierra Chart Integration using the Sierra Chart application on Windows
- Tick2Tick Dashboard
- Manual submission of Statistics Requests from any source (planned)
- Fine‑Tuning and resubmission of existing Statistics Requests
The Tick2Tick Statistics Ecosystem
The Ecosystem consists of the following core components:
Web Server
- Receives uploaded Statistics Requests
- Communicates with the database and Statistics Servers
- Handles Tick2Tick Dashboard traffic and serves the web application
Database
- Stores Statistics Requests, their settings, Signals, and all related data
- Designed with a high‑performance schema optimized for large and complex datasets
- Secure, reliable, and engineered for scalability
Statistics Servers
- Dedicated Statistics Servers that simulate and compute Statistics Requests 24/7
- Process market data at tick‑ and trade‑level precision with exceptional speed
- Communicate securely with both the Web Server and the database
Communication Routes
- All communication - both user‑facing and internal - occurs over encrypted channels
- This ensures data integrity, prevents spoofing, and protects the privacy of your information